记一次工具的升级 GDB 配合相关gdbinit 脚本,加上内置的Python脚本支持。相当舒适。
我用的是GEF[1]作为gdbinit
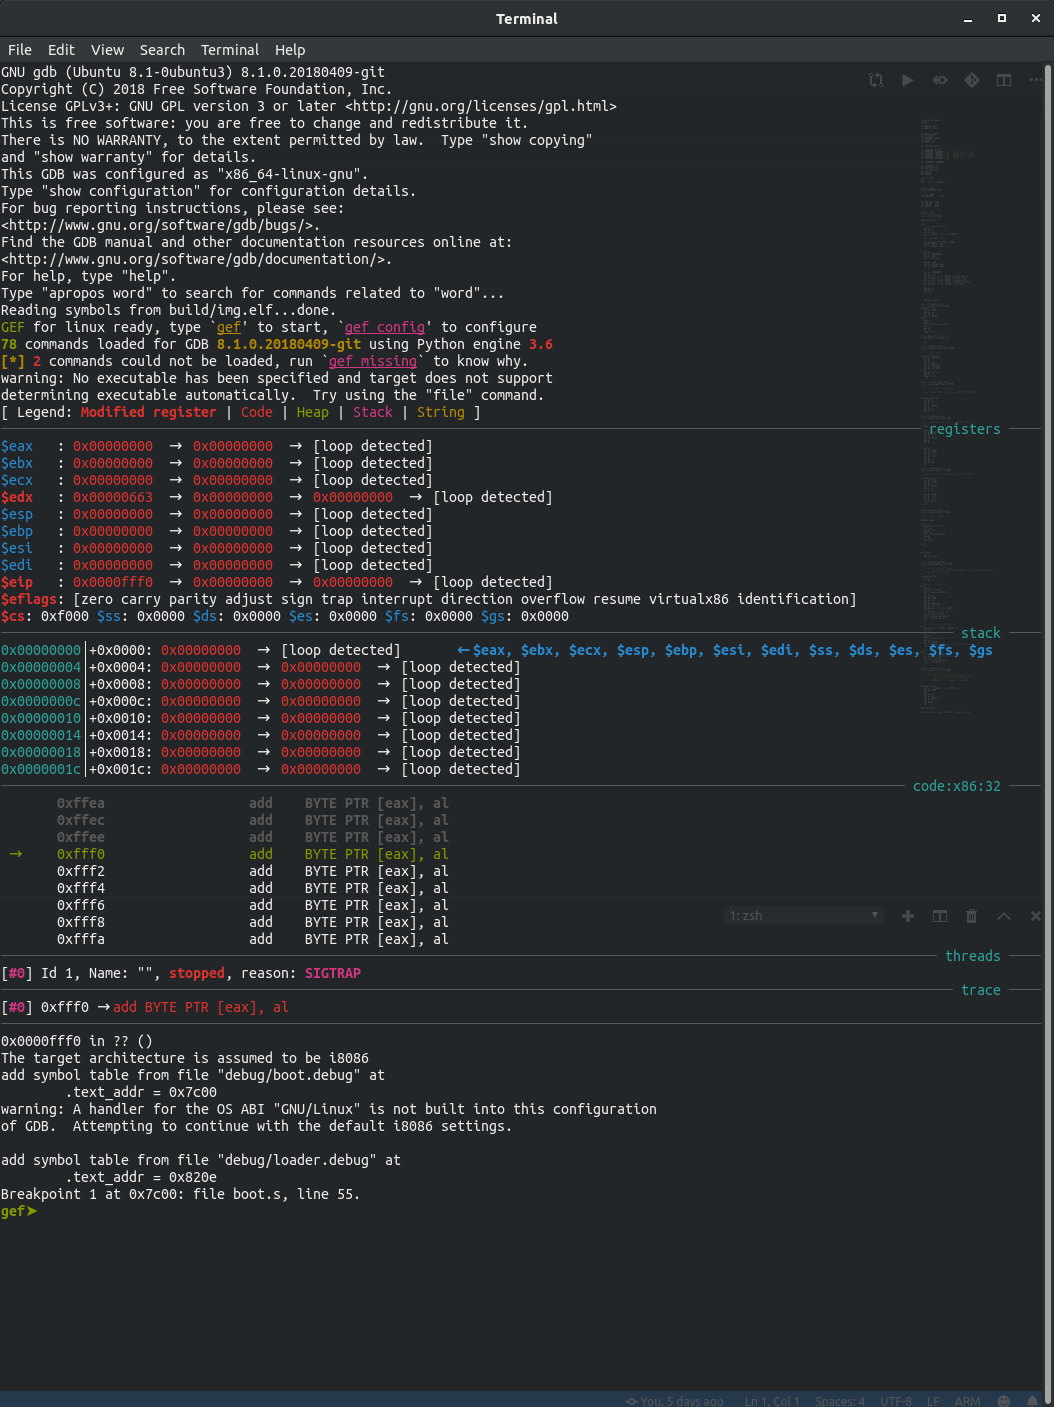
上效果图:
注意最下面The target architecture is assumed to be i8086,从这里开始后面的都是python脚本配置的
GDB 内置支持 Python
You can extend GDB using Python programming language.
写Bootloader的话,肯定要动态加载程序到内存的,这个调试就成了问题。
我是用的方案是使用objcopy来得到干净的调试符号文件之后,加载到gdb里面。
不过这就要对每个调试符号文件指定.text段的地址。
手动去查看,再手动的加入太烦了。于是就查了一下GDB的手册[2]。发现了可以使用Python来扩展。
1
2
3
4
5
6
7
8
9
10
11
12
13
14
15
16
17
18
19
20
21
22
23
24
25
26
27
28
29
30
import gdbfrom elftools.elf.elffile import ELFFiledef getSectionAddr (filename, section_name ): with open (filename, 'rb' ) as f: elffile = ELFFile(f) dot_text = elffile.get_section_by_name(section_name) if not dot_text: print ('WARNING: The section:\"{}\" dose not exists in file:\"{}\".' .format (section_name, filename)) return 0 return dot_text['sh_addr' ] def myGDBAutoLoadSymFile (filename ): addr = getSectionAddr(filename, '.text' ) gdb.execute('add-symbol-file ' + filename + ' ' + hex (addr)) def main (): gdb.execute('target remote localhost:1234' ) gdb.execute('set architecture i8086' ) gdb.execute('set disassembly-flavor intel' ) myGDBAutoLoadSymFile('debug/boot.debug' ) myGDBAutoLoadSymFile('debug/loader.debug' ) gdb.execute('b _start' ) main()
使用pyelftools[3]来获取.text段的地址。直接自动加载。
关于call和ret的匹配问题 在loader里面把boot里面的函数都给封装一下,相当于可以间接远调用了。
封装是这样的:
1
2
3
4
5
6
7
8
9
10
11
12
13
14
15
16
.global _wrap_ter_show .type _wrap_ter_show STT_FUNC _wrap_ter_show: push ds push es mov ax, 0 mov ds, ax call [_terminal_show] pop es pop ds retf
调用是这样的:
1
2
3
4
5
mov bx, OFFSET _msg4 push 0x00 push OFFSET _wrap_ter_show mov bp, sp call dword ptr ss:[bp]
这样搞,也能把这些函数直接作为中断程序了。
总结 总结一下以前的疑问:
call和ret的匹配问题,包装一下解决问题。
新的疑问:
在8086下搞重定位加载程序,总觉得好麻烦,不搞又觉得学的东西没价值,究竟搞不搞?
References
Github, “hugsy/gef”
Sourceware, “Debugging with GDB”
Github, “eliben/pyelftools”